Fig 4 - Thermal stress (Tresca) for original configuration
Result for TRESCA stress
ZOOM
Nicolas Habrias
French ERASMUS Student
Mechanical Engineering
University of Strathclyde
16429
COMPUTER AIDED ENGINEERING DESIGN
COURSEWORK 3
Project A4
December 2000
Table *
Abstract *
1 Introduction *
2 Approach *
2.1 Thermal stress comparison *
2.2 Modal analysis *
2.3 Limit thrust analysis *
3 Results and discussion *
3.1 Thermal stress comparison *
3.2 Optimisation of the thickness *
3.3 Modal analysis *
3.4 Limit thrust analysis *
4 Conclusion *
This report deals with the design study of a thermal sleeve placed at the join between a cylindrical nozzle and a spherical body of a pressure vessel. The aims of the design analysis were:
Nozzles in pressure vessels are subjected to large thermal shocks so most of the time we use a thermal sleeve. The weld region is often the weakest part of the structure and the thermal stresses are often high enough to cause the structure to yield, without the addition of stresses due to pressure.
The pressure vessel can support a fluid at 220° C. The vessel is only ever half filled, so the sphere of the nozzle is never in contact with the hot fluid. Consequently, the temperature of the inner surface of the sphere can be assumed to be 20° C.
The comparison of the old and new arrangement is shown bellow:
Fig 1- Schematic of the original and new nozzle connection.
|
Inside diameter pipe of the nozzle |
200 mm |
|
Thickness |
10 mm |
|
Inside diameter of the vessel |
1.5 m |
|
Wall thickness of the vessel |
40 mm |
|
Overall out stand of the nozzle |
500 mm |
|
Thickness of the flange |
? |
|
Air gap |
40 mm |
|
Angle |
90° |
|
Thickness of the attachment ring |
? |
|
Pump running |
120 rpm Þ The natural frequencies of the pressure vessel must be examined. |
Project A4 uses "Aluminium Alloy" with the following material properties:
|
Fig 2 – material properties of Alumin.Alloy |
||||
|
Thermal Conductivity |
Heat transfer Coefficient |
Young’s Modulus |
Expansion Coefficient |
Allow stress |
|
184W/m2K |
80W/m2K |
180000 N/mm2 |
16*10-6 |
225 N/mm2 |
The analysis of the pressure vessel was carried out using ANSYS. To start simply it was important not to use an excessive number of elements not to waste time of calculation.
In this part, 2D axis-symmetric models were created for the old and the new arrangements. The new arrangement has to be parametric. We studied the thermal stress analysis for each arrangement. Thermal stress analyse in ANSYS requires two models to be solved one after the other. A temperature distribution is followed by a stress calculation. The data from the temperature distribution is read into the second model, and the element type is the changed to determine the stresses. The stress analysis used was the "TRESCA stress". It includes a factor of safety. The analysis is carried out using the ETCHG,TTS command.
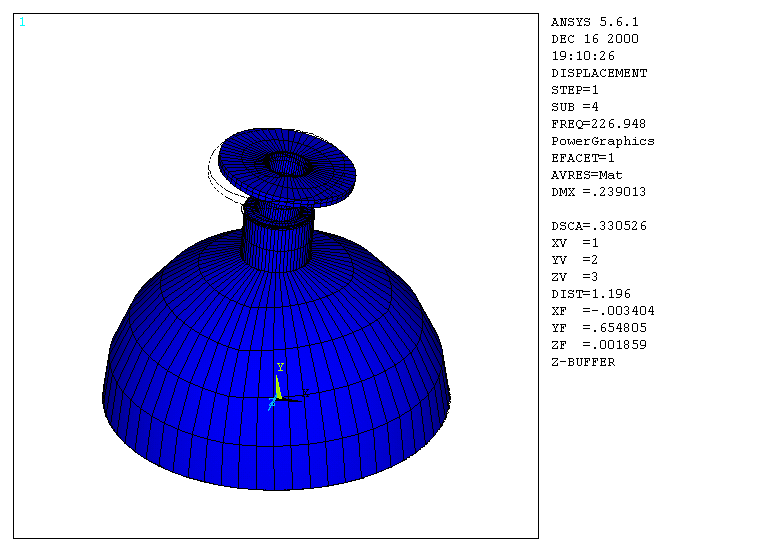
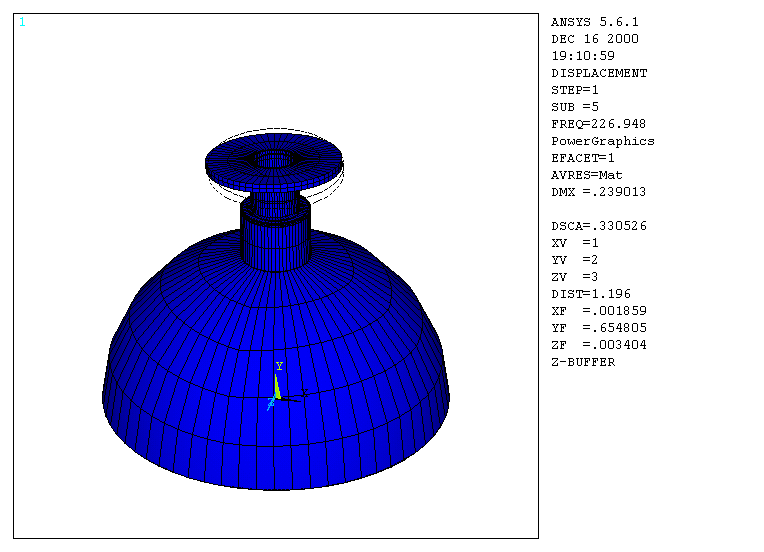
In this part, we made a 3D solid model from the 2D axis-symmetric model using the VROT command. A modal analysis was performed to determine the first 5 natural frequencies of the pressure vessel.
The limit thrust of the chosen design was established when we applied both temperature and limiting loads. We used timed load step procedures. In this case we have a non-linear plastic stress. The thrust is applied to a half-model of the pressure vessel because of the symmetry.
For all the stress analyses, the models were fixed only in the bottom.
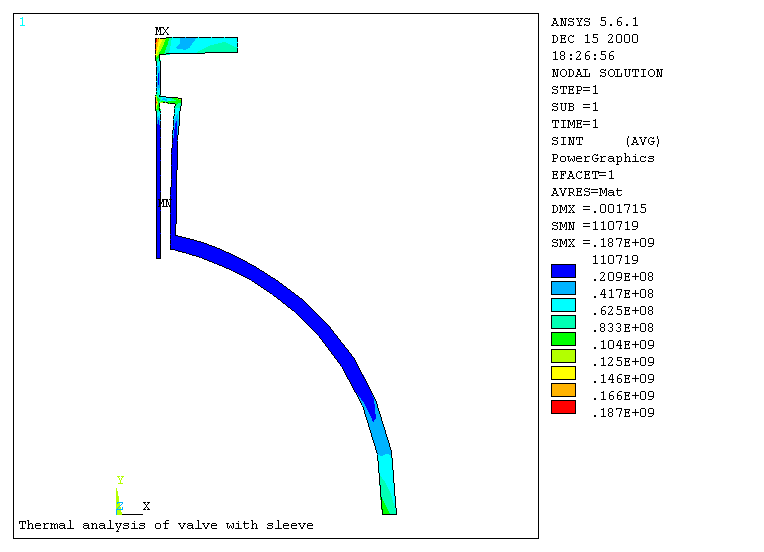
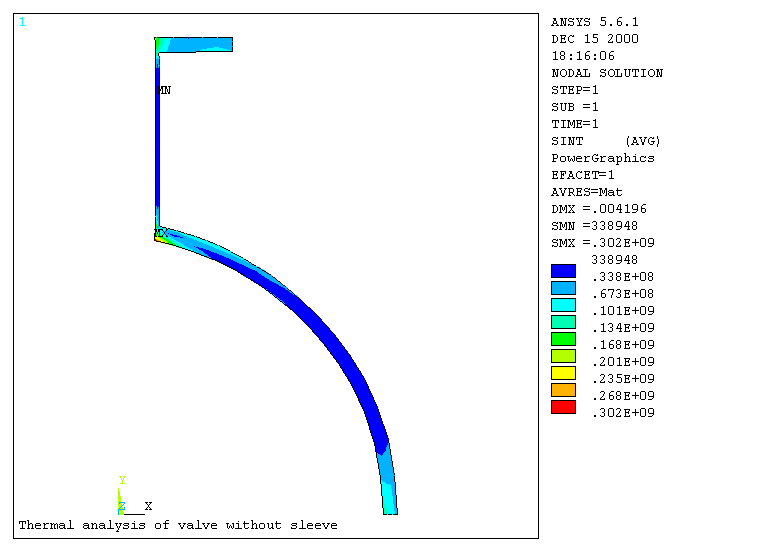
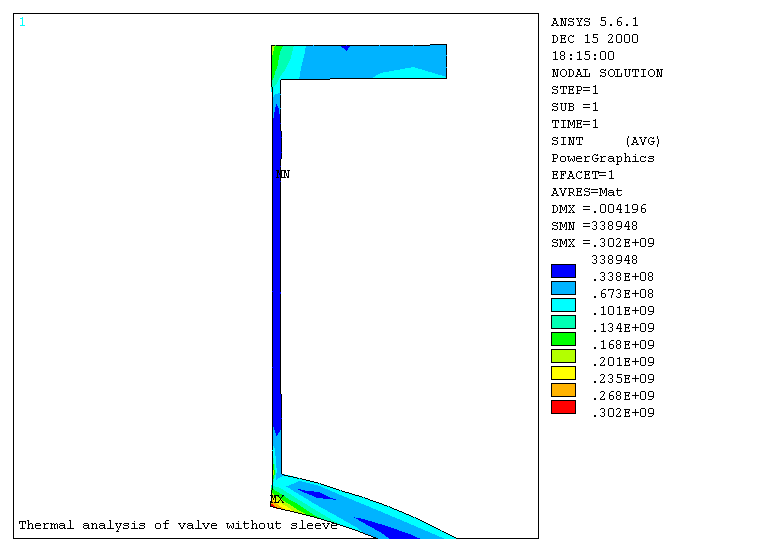
For the original arrangement ( i.e. with no thermal sleeve ) we had a thickness of 40mm for the flange and of 15 mm for the nozzle.
|
Fig 4 - Thermal stress (Tresca) for original configuration |
|
|
Result for TRESCA stress |
ZOOM |
|
|
|
It can be seen that the maximum stress occurs at the corner, where the nozzle and sphere meet. The maximum stress occurs at this point because this is where there is the highest thermal gradient. There is also a high stress in the flange.
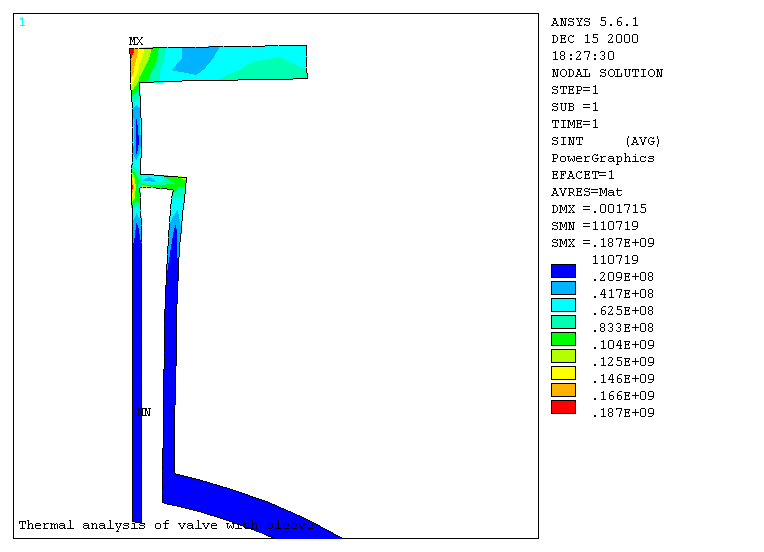
For the new arrangement, the Stress result was found to be as follows:
|
Fig 5 -Thermal stress (Tresca) for new configuration. |
|
|
Result for TRESCA stress |
ZOOM |
|
|
|
In the new configuration, the maximum stress is at the corner of the slave because of the sleeve that allowed a better distribution in the nozzle.
Comparison of the maximum values of stress:
|
Original configuration (no sleeve) |
New configuration (sleeve) |
|
302 N/mm2 |
187 N/mm2 |
We can see that the sleeve not only moves the stress from the corner of the sleeve to the slave, but also greatly reduces his value. Now, the maximum stress is under the allow stress. Consequently, it is very good.
We can now optimise the thickness of the sleeve and of the slave.
3.2 Optimisation of the thickness
|
Fig 6 - Variation of maximum stress with the thickness of the flange and the sleeve |
||
|
Flange thickness ( mm ) |
Sleeve thickness ( mm ) |
Tresca stress ( N/mm2 ) |
|
40 |
15 |
187 |
|
30 |
10 |
226 |
Case 2
With this configuration, the stress near the sleeve attachment is lower than in case 1. Nevertheless the maximum stress is sited near the flange attachment and it is higher than the allowed stress.
Conclusion:
Finally, the initial configuration was the best one. Consequently, for the rest of the problem, I will use it.
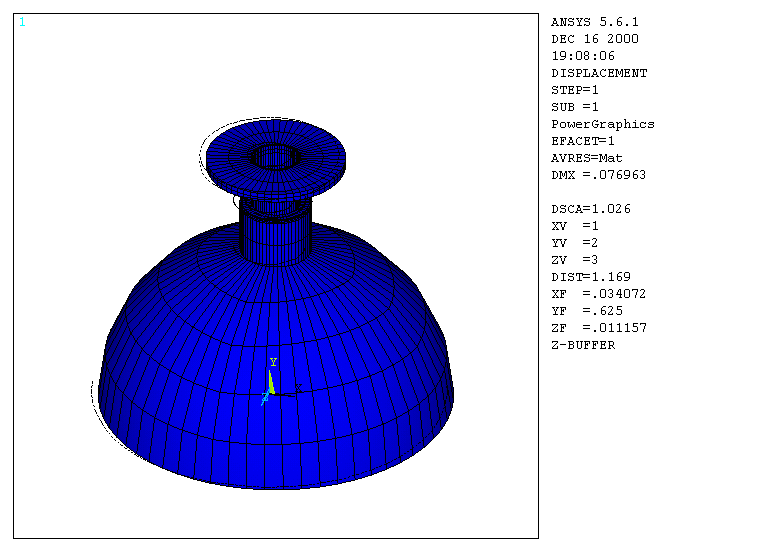
When the modal analysis was carried out, the following 5 natural frequencies were obtained:
|
Fig 8- Natural frequencies of pressure vessel |
|
|
Natural frequency |
Value (Hz) |
|
1st |
0 |
|
2nd |
0 |
|
3rd |
1.36E-30 |
|
4th |
226.95 |
|
5th |
226.95 |
N.B. The vessel was to vibration from a pump operating at 120 rpm, which was a frequency of 2Hz. There was no natural frequency corresponding to this so there will be no problems with resonance.
|
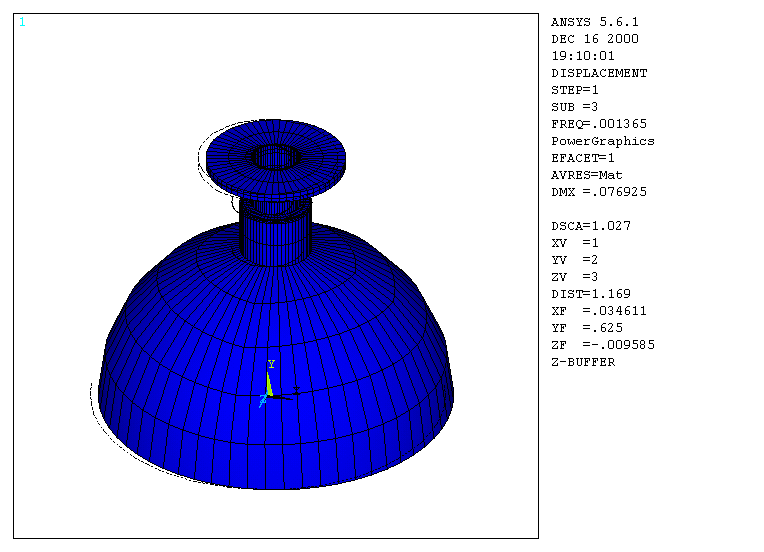
Fig 9 - 5 mode shapes from set 1 to 5 |
|
|
|
|
|
|
|
|
|
Set 1 Set 2 Set 3 Set 4 Set 5 |
These 5 mode shapes represent the free oscillations of the pressure vessel. The later modes are quite complex because of torsion movements. Nevertheless, in reality these oscillations would be damped by other connections in the system, and the movements would be less severe.
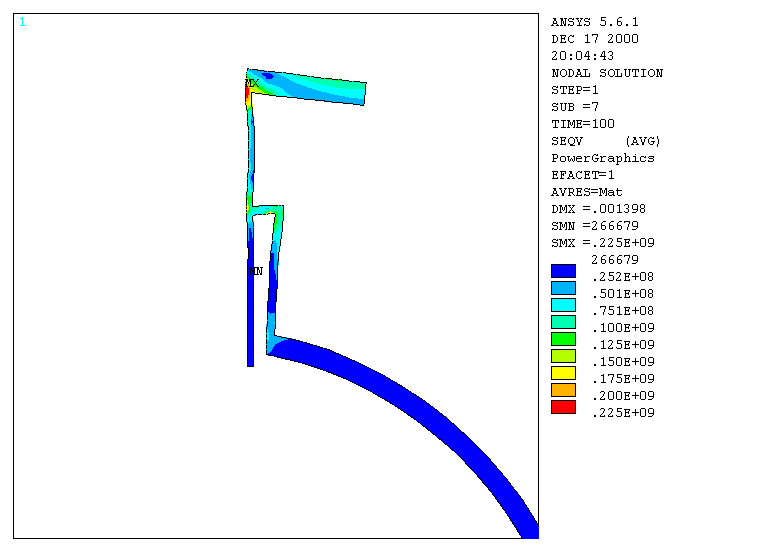
Fig 10 - Yield stresses due to external pressure and temperature
The maximum pressure allowed by the material was 1 N/mm2. The behaviour of the vessel is showed figure 10.
I also found the maximum pressure before the crack of 2.7 N/mm2.
I thought that the point of failure would have been near the attachment ring. Nevertheless it is normal that it is it near the attachment of the flange because the pressure is applied on the flange.
Finally, here are the main results of our study:
|
Best thickness of the sleeve |
15 mm |
|
Best thickness of the flange |
40 mm |
|
TRESCA stress |
187 N/mm2 |
|
No resonance |
|
|
Maximum pressure allowed by the material |
1 N/mm2 |
|
Maximum pressure before the crack |
2.7 N/mm2 |
Last but not least, this study was very interested because we analysed different things and we managed to do different acts in the same problem:
Such a problem would have been very difficult to solve without ANSYS so now I believe that ANSYS is a very useful software.